Creating an Animated ShotMap with NHL’s Stats API
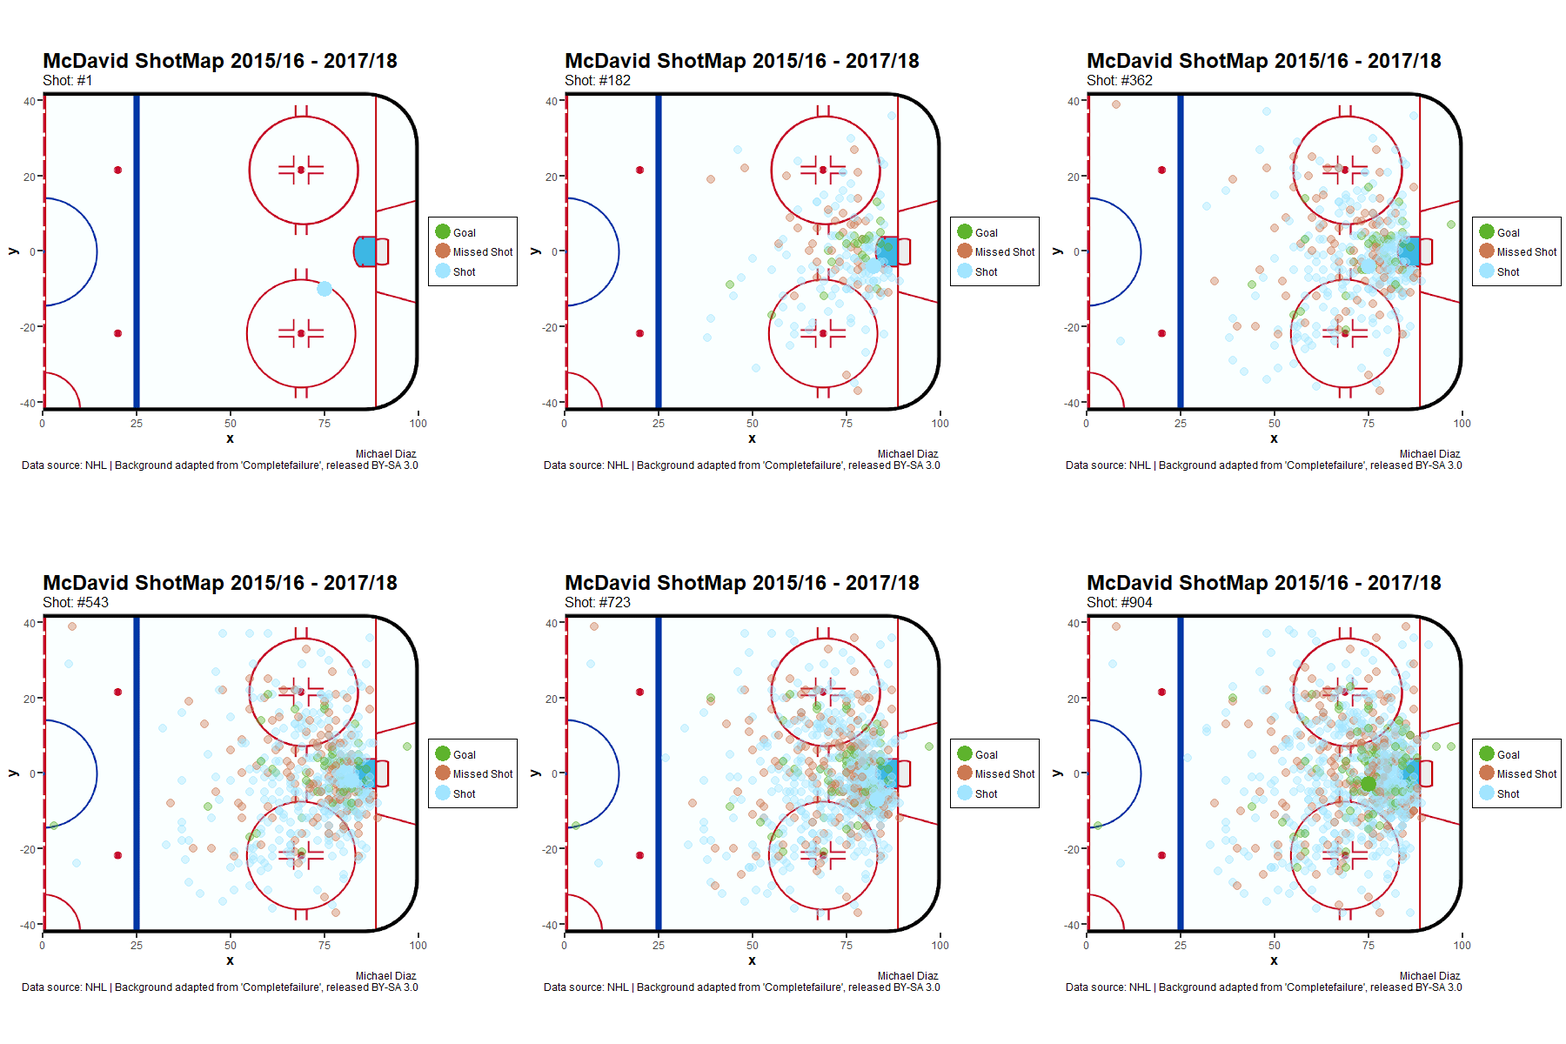
Using R and NHL’s stats API, I created an animated ShotMap of McDavid’s 409 recorded shots between his debut game and the end of the 2018 season.
Getting NHL Play by Play data from the API
## Function returns URL for team's schedule between given dates
gen_url_pks <- function(teamId,date1,date2){
  URL <- paste('http://statsapi.web.nhl.com/api/v1/schedule?teamId=',teamId,'&startDate=',date1,'&endDate=',date2, sep = "")
  return(URL)
}

## Function returns URL for game data
get_url_pbp <- function(gameId){
  URL <- paste('https://statsapi.web.nhl.com/api/v1/game/',gameId,'/feed/live',sep = "")
  return(URL)
}

## Get data from NHL API
data_raw <- content(GET(gen_url_pks('22','2015-10-01','2018-07-01')))

data_tib <- enframe(unlist(data_raw$dates)) #Turn raw data into organized tibble
data_tib <- data_tib %>% separate(name, into = c(paste0("x", 1:5)),fill = "right")

gameIds <- data_tib %>% filter(x2 == "gamePk") #Extract gameIds
gameIds_list <- as.list(gameIds$value)
Extracting useful data
##Create list of player's shots from game list##
player_shots <- list()
for (gameId in gameIds_list) {
  print(gameId)
  pbp_raw <- content(GET(get_url_pbp(gameId)))

  #Get all Shot type events
  pbp_events <- pbp_raw$liveData$plays$allPlays
  shot_events <- list()
  for (substring in pbp_events) {
    if (substring$result$event %in% c('Shot','Missed Shot','Goal')) {
      shot_events[[length(shot_events)+1]] <- substring
    }
  }

  #Filter out player
  for (substring in shot_events) {
    if (substring$players[[1]]$player$fullName == 'Connor McDavid') { ### Hard coded player name | TO FIX
      player_shots[[length(player_shots)+1]] <- substring
    }
  }
}

##Filter data into organized tibble##
player_tibs <- tibble(shotId = numeric(),
                      date = date(),
                      type = character(),
                      secondaryType = character(),
                      x = numeric(),
                      y = numeric())

for (shot_event in player_shots) {
  player_tibs <- add_row(player_tibs,
                        shotId = nrow(player_tibs) + 1,
                        date = shot_event$about$dateTime,
                        type = shot_event$result$event,
                        secondaryType = if (is.null(shot_event$result$secondaryType)) {'N/A'}
                          else {
                            shot_event$result$secondaryType
                        },
                        x = if (is.null(shot_event$coordinates$x)) {
                          75
                          } else if (shot_event$coordinates$x < 0) { #Flip neg x cords
                            -shot_event$coordinates$x
                          } else {
                            shot_event$coordinates$x
                          },
                        y = if (is.null(shot_event$coordinates$y)) {
                          5
                          } else if (shot_event$coordinates$x < 0) { #Flip y cords when x is neg
                            -shot_event$coordinates$y
                          } else {
                            shot_event$coordinates$y
                          })
                        }
Animation with ggplot2 and gganimation
##Create plot and base animation
bg_img <- png::readPNG('bgB.png')
p2 <- ggplot(player_tibs, aes(x,y,group=date, color = type))+

  coord_fixed(ratio = 1,xlim = c(0, 100), ylim = c(-42.5,42.5))+
  scale_x_continuous(expand = c(0, 0)) + scale_y_continuous(expand = c(0, 0))+
  background_image(bg_img)+

  theme(
    panel.background = element_rect(fill = "transparent"),
    panel.grid.major = element_blank(),
    panel.grid.minor = element_blank(),
    plot.title = element_text(size = 24, face = "bold"),
    plot.subtitle = element_text(size = 16),
    plot.caption = element_text(size = 12),
    plot.background = element_rect(fill = "transparent", color = NA),
    axis.line = element_blank(),
    axis.ticks = element_line(size = 1),
    axis.ticks.length = unit(.2, "cm"),
    axis.text = element_text(size=12),
    axis.title = element_text(size = 16, face = "bold"),
    legend.background = element_rect(fill = "transparent"),
    legend.box.background = element_rect(fill = "transparent"),
    legend.key = element_rect(fill = "transparent"),
    legend.text = element_text(size = 12),
    legend.title = element_blank())+

  scale_color_manual(values = c("#5EB32D", "#CC7952", "#A2E5FF"))+

  labs(title = "McDavid ShotMap 2015/16 - 2017/18",
       subtitle = "Shot: #{next_state}",
       caption = "Michael Diaz \n
       Data source: NHL | Background adapted from 'Completefailure', released BY-SA 3.0")+

  geom_point(alpha = 1, size = 8, stroke = 1)+
  transition_states(shotId)+
  shadow_mark(past = TRUE, future = FALSE, size = 4, alpha = .4)


animate(p2,
        detail = 2,
        nframes = 904, #(frames x 2)
        fps = 25,
        height = 600,
        width = 600)

anim_save(paste('ShotMap_McDavid',Sys.Date(),'25.gif', sep = ""),animation = last_animation())

API copyright notice: NHL and the NHL Shield are registered trademarks of the National Hockey League. NHL and NHL team marks are the property of the NHL and its teams. © NHL 2019. All Rights Reserved.
